|
Yarmouth Weather & Climate
Forecast & Current Conditions for Yarmouth
Current observations from the National Weather Service’s station at Portland International Jetport: wind, sky/weather conditions, temperature, dew point, barometric pressure, and precipitation, and 7-day forecast, with grids pin-pointed to within five miles of Yarmouth.
Bates Street Obs
Current observations from KMEYARMO22, a reporter to Weather Underground west of Yarmouth village. Reports include temperature, dew point, relative humidity, wind speed and direction, and air pressure, as well as sunrise and sunset times for the current day, and weather history graphs for the day.
Northwood Rd
Current observations and weather history from KMEYARMO13, a personal weather station, east of Yarmouth village.
Sligo Road Obs
Current observations and weather history from KMEYARMO9, a personal weather station, at 125 Sligo Road in Yarmouth, just north of the village.
North Yarmouth Obs
Current observations and weather history from KMENORTH10, a personal weather station, just north Dunn's Corner, the next town north of the village.
Gray NWS Home Page
Provides data on Current Hazards, Current Conditions, Radar, Satellite, Forecasts, Climate, Weather Safety for southern and western Maine.
Portland 3-Day Weather History
Hourly observations from the National Weather Service’s station at Portland International Jetport for the current and previous 71 hours: wind, sky/weather conditions, temperature, dew point, barometric pressure, and precipitation.
Weather Spotter Reports
These reports are made by amateur weather observers who have taken the NWS Weather Spotter training course. Covers a wide area of southern and western Maine.
Latest Reports
Data will be updated according to the type of event last experienced. Because of this, some data may be from a previous storm. For example, the latest storm may have produced snow, but not high winds. In that case the snow would be current, but the wind data would be from the last wind event.
Gray Daily Climate Report
Updates twice daily, usually around 4 A.M. and 4 P.M. The afternoon report shows same-day climate with data up to 4 P.M.; the morning report summarizes for the previous day in its entirety.
Gray Climate Records
This link also has tables for other areas served by the Gray office; please navigate with care.
Climate Information Library — Gray NWS
A rough guide to southern Maine's weather history. All data that appears on this page is preliminary and subject to correction before being published by the National Climatic Data Center or the Northeast Regional Climate Center.
Portland Daily 30-Year Normals
Tables showing the normal high and low temperatures in Portland, Maine, for each day of each month.
Portland Climate Normals
The source for the data is U.S. Climate Data. While the site's About Page is not forthcoming about the organization that provides the data, the data itself appears to be authentic. If and when the NWS decides to post this data again in searchable format, we'll revert back to their pages.
Weather & Climate Media
Gray NWS Office Camera Current Image
Web cam located on the Doppler radar pedestal, looking toward the north and west. You will now be able to see weather approaching in real time and watch it in the time lapse loops! There's also a link, below the image, to a chart that names the topographical features — including Mount Washington — visible in the distance on a clear day.
Mount Washington Observatory
Current summmit conditions, 24hour stats, almanac data, vertical temperature profile, mesonet readings, webcams, archives, and more!
Central Maine Power Company Twitter
Power loss updates.
Tools & Charts
Beaufort Scale
Called “science turned into poetry,” this 19th Century chart for determining wind speed by observing its effect on smoke, trees, and buildings is still used today by amateur and professional alike.
Wind Chill Chart
While scoffed at by many professionals, this scale is nonetheless a useful formula for calculating the dangers from winter winds and freezing temperatures. This chart is from the National Weather Service Office of Climate, Water, and Weather Services; used wisely, it could save your life – or at least a digit.
Weather Forecast Chart
With a barometer, a Beaufort Scale, and an eye to the sky, you can predict the weather. This table, a web version of the one that appears in Paul Lehr’s classic book “Weather: A [Golden Science] Guide To Phenomena and Forecasts,” was created by a kindred spirit in Massachussets whose own website has been rendered nearly useless by his internet host. We’ve provided a copy on our own site, to which this link points.
Meteorological Conversions (WPC)
Calculators for
Temperature (Fahrenheit to Celsius to Kelvin)
Wind Chill
Heat Index
Wind Speed (Miles/hour to kilometers/hour to meters/second to knots)
Relative Humidity
Barometric Pressure (millibars to inches to millimeters)
Precipitation (hundreths of an inch to inches to millimeters to centimeters)
This site also presents tables for many of the above conversions.
Meteorological Conversions (NWS)
Calculators:
Convert Temperature
Calculate Wind Chill
Calculate Heat Index
Wind Speed Conversions
Calculate Relative Humidity
Convert Precipitation
Density Altitude Calculator
Convert Pressure
Tables:
Celsius to Fahrenheit Conversion Table
Fahrenheit to Celsius Conversion Table
Inches of Mercury to Millibars Conversion Chart
Millibars to Inches of Mercury Conversion Chart
MPH to Knots to Meters Per Second Conversion Chart
Knots to MPH to Meters Per Second Conversion Chart
Values in a Standard Atmosphere
Dewpoint Comfort Scale
This creation by our correspondent, L.M., is a useful guide to understanding how dewpoint, rather than relative humidity, is a better index to how the amount of moisture in the air will make you feel.
Maps & Satellite Graphics
Maine Forecast Zone Map
Shows the NWS Forecast Zones, with their numbers.
GoMOFS (Gulf of Maine Operational Forecast System)
For decades, mariners in the United States have depended on NOAA's Tide Tables for the best estimate of expected water levels. These tables provide accurate predictions of the astronomical tide (i.e., the change in water level due to the gravitational effects of the moon and sun and the rotation of the Earth); however, they cannot predict water-level changes due to wind, atmospheric pressure, and river flow, which are often significant.
To better serve maritime user community, a new three-dimensional Gulf of Maine Operational Forecast System (GoMOFS) was developed by the NOAA/National Ocean Service/Office of Coast Survey in a joint project with the NOAA/NOS/Center for operational Oceanographic Products and Services (CO-OPS) and the NOAA/National Weather Service/National Centers for Environmental Prediction (NCEP) Central Operations (NCO) using Rutgers University's Regional Ocean Modeling System (ROMS). GoMOFS generates nowcasts (analyses of near present) and forecast guidance of water level, current, temperature and salinity out to 72 hours, four times per day. Aerial animations of the whole Gulf of Maine as well as time series at particular stations or points of interest are available for over 20 locations for the five parameters (water level, currents, temperature, and/or salinity). GoMOFS will assist U.S. port authorities and mariners in efficiently navigating the Gulf of Maine without compromising safety.
GoMOFS runs on NOAA's High Performance Computers (HPC) in a new Coastal Ocean Modeling Framework (COMF) developed by CO-OPS. As a result, GoMOFS has direct access to National Weather Service operational meteorological products that it needs to run reliably.
NOAA Tides & Currents
Access local water levels, tide and current predictions, and other oceanographic and meteorological conditions from the Center for Operational Oceanographic Products and Services.
Advanced Hydrologic Prediction Service
Advanced Hydrologic Prediction Service is a web-based suite of accurate and information-rich forecast products. They display the magnitude and uncertainty of occurrence of floods or droughts, from hours to days and months, in advance.
NASA GOES-12 Northeast Satellite
GOES-12 is the geostationary satellite which hovers over the east coast, beaming back visible, infrared, and water vapor images 24 hours a day. The main map is “clickable” for a close-up picture and can be animated. For more on the kinds of images and how to interpret them, select “More about these images” under the picture. For a tour of all the buttons and symbols, be sure to read “Usage tips.”
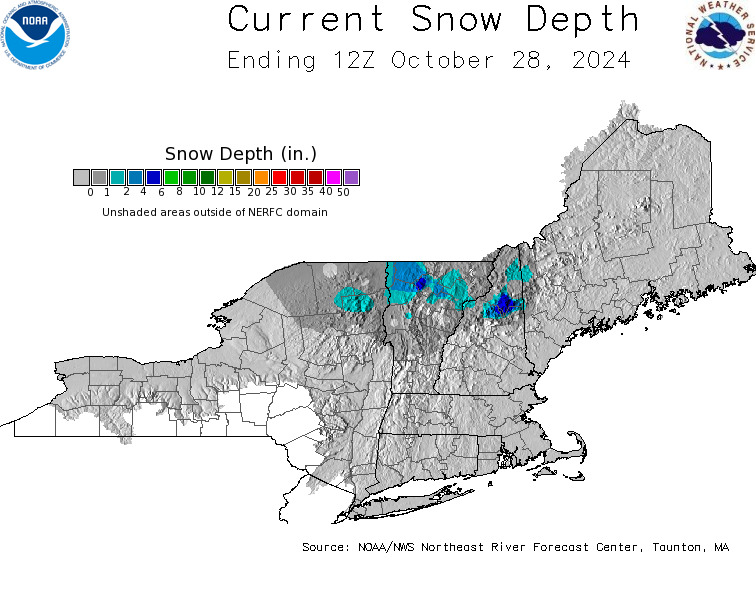
Current Snow Pack
Daily graphical report of the height of snow on the ground statewide.
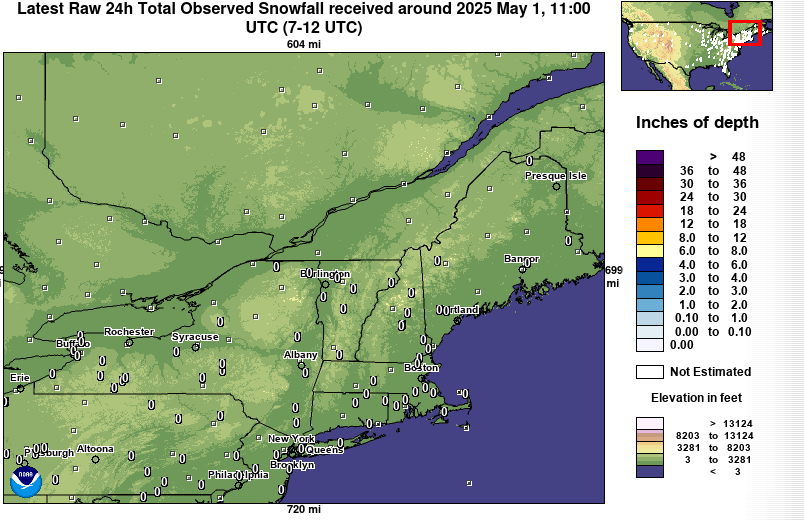
Daily Snowfall Map
Daily graphical report of snowfall, ending 1200 UTC (aka, GMT), updated daily.
Maine Forest Service Forest Fire Danger Report
Daily graphical report displaying the fire danger in all zones across Maine. The ratings are explained in a link at the bottom of the page.
DEP Air Quality Forecast
Air Quality Forecasts are scheduled to be updated by 3:00 pm weekdays and other times as necessary. Forecasts are also available on the Bureau's Air Quality Hotline at (800) 223-1196.
Maine Drought Map
The U.S. Drought Monitor, established in 1999, is a weekly map of drought conditions that is produced jointly by the National Oceanic and Atmospheric Administration, the U.S. Department of Agriculture, and the National Drought Mitigation Center (NDMC) at the University of Nebraska-Lincoln. The U.S. Drought Monitor website is hosted and maintained by the NDMC.The U.S. Drought Monitor, a composite index that includes many indicators, is the drought map that policymakers and media use in discussions of drought and in allocating drought relief.
NWS Gray Drought Information
Repeats the regional map from the U.S. Drought Monitor (see link above) and the national map from the Climate Prediction Center's U.S. Monthly Drought Outlook page. Also includes links to NOAA's other drought-related pages and state & regional resources.
Daily Streamflow Conditions
One way to quantify just how dry it has been is by using streamflow data. The colored dots on this map depict streamflow conditions as a percentile, which is computed from the period of record for the current day of the year. Only stations with at least 30 years of record are used.
Weather Prediction Center
Formerly the Hydrometeorological Prediction Center, the WPC is used by weather professionals, but is also useful to the informed amateur. The QPF (Quantitative Precipitation Forecast) maps on the homepage are especially useful when heavy rain or snow is forecast, and require no knowledge of meteorology to interpret.
National Digital Forecast Database
The National Digital Forecast Database (NDFD) consists of gridded forecasts of sensible weather elements (e.g., cloud cover, maximum temperature). NDFD contains a seamless mosaic of digital forecasts from NWS field offices working in collaboration with the National Centers for Environmental Prediction (NCEP).
NOAA Environmental Visualization Laboratory
Animations and images featuring NOAA's remotely-sensed data
NOAA Weather View
The global winds visualization uses a tracers technique to show the speed and direction of winds across the planet. In addition, other imagery and data can be co-displayed.
Earth
An animated map of global wind, weather, and ocean conditions.
Zoom Earth
Zoom Earth shows live weather satellite images and the most recent aerial views of the Earth in a fast, zoomable map. Explore near real-time high-definition images, rainfall radar maps, animated wind maps, storms, wildfires and more.
Jet Stream Map
The Jet Stream map shows today's high wind speed levels and jetstream directions. Jet streams are fast flowing, relatively narrow air currents found in the atmosphere around 10 kilometers above the surface of the Earth. They form at the boundaries of adjacent air masses with significant differences in temperature, such as the polar region and the warmer air to the south. The jet stream is mainly found in the tropopause, at the transition between the troposphere (where temperature decreases with height) and the stratosphere (where temperature increases with height).
Foul Weather Tools (See also Hurricane Watch, below)
Storm Prediction Center
The Storm Prediction Center is part of the National Weather Service and provides timely and accurate forecasts and watches for severe thunderstorms and tornadoes over the contiguous United States. The SPC also monitors heavy rain, heavy snow, and fire weather events across the U.S. and issues specific products for those hazards.
Maine Emergency Management Agency
Home page for the state agency that deals with all emergencies, not just weather-related. The Weather Information page repackages National Weather Service information as it pertains to potential threats such as severe storms and flooding, etc.
Central Maine Power
Report an outage, view a list of electric outages and restoration status, or view a map of current electric outages and restoration status.
New England 511 Website
Displays a map of active known incidents (e.g., bridge closures for marine traffic), hazards, construction sites, and road closures. Also displays a number of roadside cameras.
Hurricane Watch
Note: some of these sites are also useful for other types of foul weather awareness.
National Hurricane Center
This is the source of official information for tropical storms. Commercial sites may offer useful information, but if life and limb are at risk, accept no substitutes. The National Hurricane Center maintains a continuous watch on tropical cyclones from May 15th in the eastern Pacific and June 1st in the Atlantic through November 30. The Center prepares and issues forecasts, watches and warnings within text advisories and graphical products. There is also much useful information about hurricanes in the “Learn About Hurricanes” section, as well as informative historical data in the “Hurricane History” section.
Naval Research Laboratory Monterey Marine Meteorology Division Tropical Cyclone Page
With a name like that, it can only be a government site, and indeed, this is the Navy’s tropical cyclone (hurricane and typhoon) watch site. Great satellite pictures of the storms and solid data and forecast information. Site design looks like the control panel for a battleship, but once you have learned its navigation, you’ll be docking your mouse like an admiral.
NHC Atlantic Ops
National Hurricane Center's twitter account, providing analyses, forecasts, and warnings of tropical cyclones and disturbances over the Atlantic basin.
Saffir-Simpson Hurricane Wind Scale
The Saffir-Simpson Hurricane Wind Scale is a 1 to 5 rating based on a hurricane's sustained wind speed. This scale estimates potential property damage. Hurricanes reaching Category 3 and higher are considered major hurricanes because of their potential for significant loss of life and damage. Category 1 and 2 storms are still dangerous, however, and require preventative measures. In the western North Pacific, the term "super typhoon" is used for tropical cyclones with sustained winds exceeding 150 mph.
Saffir-Simpson Hurricane Wind Scale Extended Table
Table shows each category of hurricane and lists the consequences of damage in terms of People, Livestock, and Pets; Mobile Homes; Frame Homes; Apartments, Shopping Centers, and Industrial Buildings; High-Rise Windows and Glass; Signage, Fences, and Canopies; Trees; Power and Water.
Tropical Cyclone Names
Since 1953, Atlantic tropical storms had been named from lists originated by the National Hurricane Center. They are now maintained and updated through a strict procedure by an international committee of the World Meteorological Organization. The six lists on this page are used in rotation and re-cycled every six years, i.e., the 2016 list will be used again in 2022. The only time that there is a change in the list is if a storm is so deadly or costly that the future use of its name on a different storm would be inappropriate for reasons of sensitivity.
Atlantic Basin Storm Name Pronunciations
Regional results may vary, but this is how the NHC will be pronouncing them.
Gulf of Maine Bouys
While principally of use to mariners and those who make their living off the sea, the information on this site can be enlightening to landlubbers during storm activity and when ocean weather such as onshore winds affects them most directly.
Weather Channel Tropical Update
Commercial sites such as AccuWeather’s and the Weather Channel’s can be a rich source of information for the more casual weather observer, because the information is presented less technically and the site layout can be more easily navigated. We nonetheless advise our readers to not be fooled by the more frequent “updates” these sites offer during storms -- they’re using the same tools the more cautious National Hurricane Center is using -- and to rely on the NHC, local National Weather Service, and local emergency broadcast system services when life and limb are at stake.
Tropical Meteorology Project
The Tropical Meteorology Project is headed by Colorado State University’s Dr. William Gray, who for more than 40 years has investigated meso-scale tropical weather phenomena, specializing in the global aspects of tropical cyclones. The site offers Gray’s annual Tropical Storm Forecast, probabilities of landfalling tropical cyclones along the United States coastline from Brownsville, TX to Eastport, ME, and other weather products, research, and articles from TMP and other Colorado State University researchers.
Joint Typhoon Warning Center
Located at Naval Base Pearl Harbor, Hawaii, the Joint Typhoon Warning Center (JTWC) is the U.S. Department of Defense agency responsible for issuing tropical cyclone warnings for the Pacific and Indian Oceans. Official JTWC support is provided to all branches of the U.S. Department of Defense, and other U.S. government departments and their agencies such as the State Department (U.S. Embassies and Consulates), and the Department of Commerce (U.S. National Weather Service). JTWC products are intended for use by operational units in making decisions on ship movements, aircraft sorties and operational planning and by other government agencies in their respective support and international cooperation roles.
Tropical Cyclone Rainfall Data
Data is available for tropical and subtropical cyclones that impacted the U.S. from 1963 onward to the present, and Mexico between 1995 and 2003, as well as some older historic storms.
Winter Weather Watch
GYX Winter Weather Information
When a storm is approaching, start here.
Probabilistic Snowfall Forecast
A little more detail, after you've consulted the site above. Also forecasts for ice accumulation potential.
WPC Probabilistic Winter Precipitation Guidance
Interactive U.S. map showing the probability of snow or ice accumulating an inch or more in 24-hour periods.
Maine Snow Information and Forecasts
Just about everything you need to know about Maine snow.
Snow Pack Page
Just how deep is it? This map of the state shows on-the-ground snow depths across the state.
Daily Snowfall Map
Daily graphical report of snowfall, ending 1200 UTC (aka, GMT), updated daily.
Wind Chill Chart
While scoffed at by many professionals, this scale is nonetheless a useful formula for calculating the dangers from winter winds and freezing temperatures. This chart is from the National Weather Service Office of Climate, Water, and Weather Services; used wisely, it could save your life – or at least a digit.
Winter Safety & Awareness
Know how to deal with winter weather, how to understand forecasts and warnings, how to be prepared for being out in winter’s worst – even unexpectedly. Also some fascinating information on how climatic forces in the tropics affect weather at the mid-latitudes, and there are some stories about the “Billion Dollar Winter Storms” (and you thought only hurricanes could rack up a bill?).
Winter Weather Criteria & Definitions
Terms used in forecasts. Are you sure you know the difference between a Winter Storm Watch and a Warning? Snow showers and flurries? Sleet and freezing rain? This involves more than just splitting frosty hairs; the distinctions can make the difference between a wise and foolish decision that could change your life.
General Weather & Climate Sites
These sites are recommended for general information and for deepening one's understanding of meteorology and climatology.
JetStream - An Online School for Weather
JetStream is the National Weather Service Online Weather School. This site is designed to help educators, emergency managers, or anyone interested in learning about weather and weather safety.
The information contained in JetStream is arranged by subject; beginning with global and large scale weather patterns followed by lessons on air masses, wind patterns, cloud formations, thunderstorms, lightning, hail, damaging winds, tornados, tropical storms, cyclones and flooding. Interspersed in JetStream are "Learning Lessons" which can be used to enhance the educational experience.
Atmos Meteorology Online Guides
Teach yourself meteorology! The Online Guides use multimedia technology and the dynamic capabilities of the web. These resources incorporate text, colorful diagrams, animations, computer simulations, audio and video to introduce topics and concepts for a wide variety of disciplines. The target audience for the Online Guides is high school and undergraduate level students. However, these resources have been used by instructors throughout K-12, undergraduate and graduate level education. A product of the University of Illinois at Urbana-Champaign’s Department of Atmospheric Sciences.
Jeff Haby's Weather Prediction School
From the Purpose Page: The main focus of this web site is weather prediction education. While there are many websites for retrieving weather data, there remains somewhat of a lack of weather data interpretation and forecasting methods. This site will benefit the beginner as well as the advanced forecaster.
NOAA Homepage
A publication of the National Oceanic & Atmospheric Administration. The grand-daddy of the other National Weather Service weather sites we post here. Contains forecast and advisory information about active weather, achives of weather and climate information, news articles, and more.
National Climatic Data Center
NCDC is the world’s largest active archive of weather data. NCDC produces numerous climate publications and responds to data requests from all over the world. The repository of OFFICIAL records and argument-settling data. Not the most user-friendly site ever made, nor is everything free, but the determined miner will find a rich lode.
National Weather Service Abbreviations and Acronyms
While some creative writers make up their own, these are the ones commonly used in NWS Forecast Discussions.
NWS Glossary
Browsable and searchable database of terms used in NWS Forecast Discussions.
Nino/Nina Southern Oscillation
Perhaps the best-known arm of NOAA's Climate Prediction Center, ENSO tracks observations of El Nino & La Nina and makes climate predictions based on that data. This page also includes a wealth of information about El Nino & La Nina – scientific, historical, etc.
Old Farmer’s Almanac
The original. Often imitated, never equalled. Now online -- with its own hole (though we haven’t an ether-hook to hang it on).
Maine Fall Foliage
The Official Fall Foliage site, powered by the Maine Department of Conservation. The foliage reports – with free online help – begin in mid-September each year, but the site has information and photos all year 'round.
SnowCrystals.com
This site is all about snow crystals and snowflakes -- what they are, where they come from, and just how these remarkably complex and beautiful structures are created, quite literally, out of thin air.
Casco Bay Continuous Monitoring Station
The station consists of a data sonde, an instrument that can measure several properties of water at once, and a separate device that measures carbon dioxide. These electronic devices are secured together in a repurposed lobster trap on the ocean floor. This station, located off Yarmouth near the coastal midpoint of Casco Bay, was launched in 2016. The station collects data once an hour, every hour, year round.
|

